The Prediction Architecture Program
established that embodied agents carry faint world- and self-model signals. A variant that added inner processing ticks, since removed, found no adaptive deliberation. ask a sharper question: what kind of learning signal couples hidden dimensions into a non-decomposable representation?
V9–V11: Prediction Is Not Integration
Each environment step the agent predicts its own energy change, observes the truth, and updates its phenotype by gradient descent, the computational version of minimizing surprise about your own persistence:
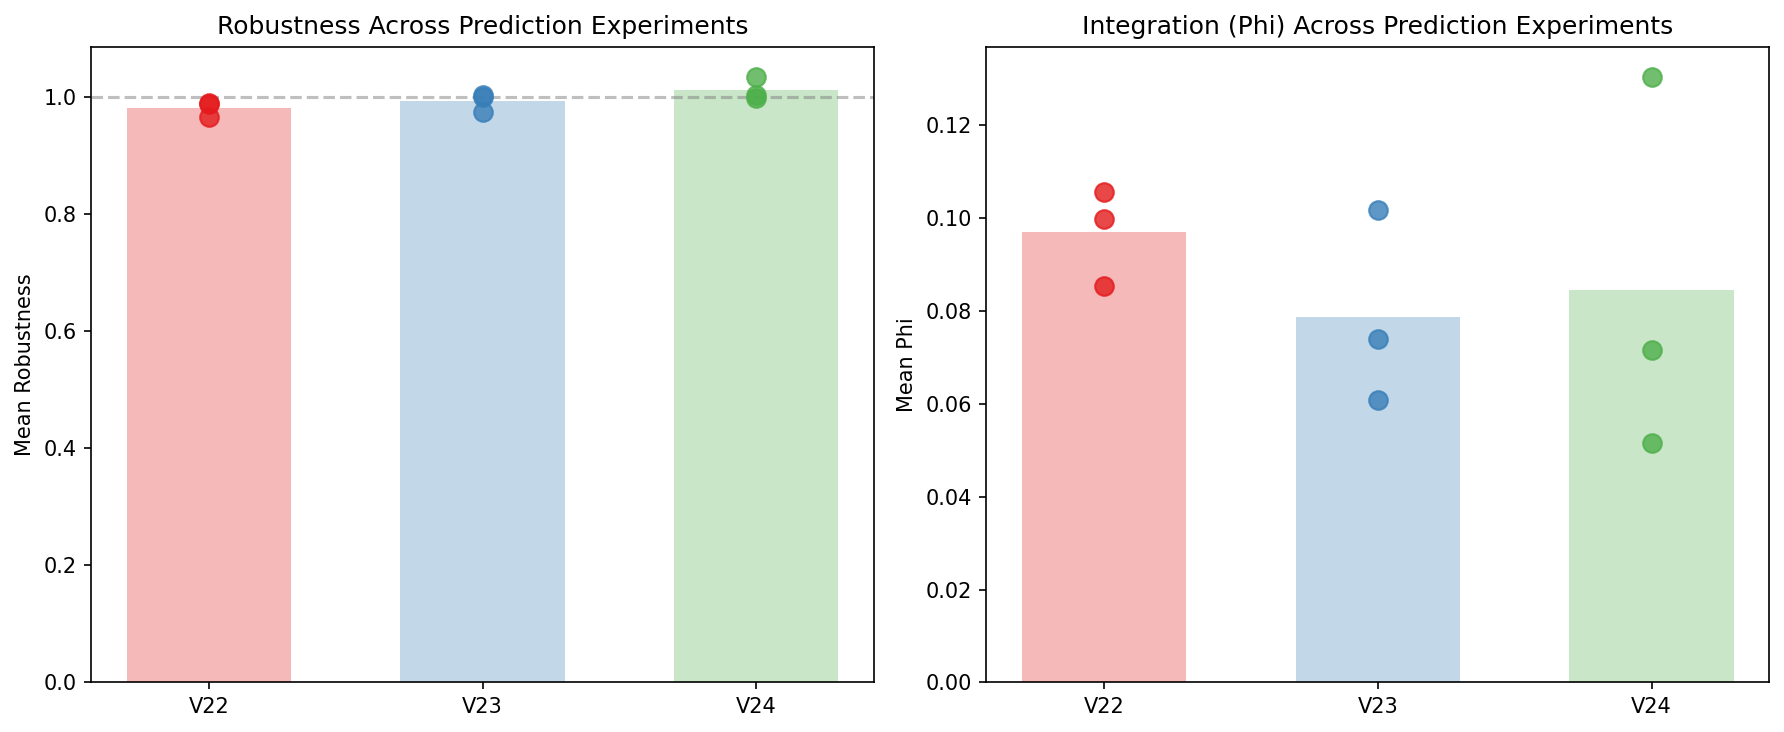
| Study | Target | Mean (3 seeds) | Note |
|---|---|---|---|
| Own energy | 0.097 | Prediction error falls 100 to 15,000× per lifetime | |
| Energy, resources, neighbors | 0.079 | Weight columns specialize; specialization is more partitionable | |
| Long-horizon value | 0.084 | Best robustness (1.012); discount evolves to about 0.75 |
Within-lifetime learning works, and better prediction does not become higher integration on any target. A single linear readout can be satisfied by a subset of hidden units, so it creates no pressure to coordinate. That is the decomposability problem: linear readouts are always factored.
Study record: metadata, result path, seeds, source code, and key finding for .
V12 and V13: What the Two-Layer Head Did
A two-layer head couples gradients across hidden units through the chain rule, so no single unit can satisfy the objective alone:
| Seed | Mean | Max | Effective rank | Silhouette |
|---|---|---|---|---|
| 42 | 0.079 | 0.128 | 8.24 | 0.325 |
| 123 | 0.071 | 0.091 | 6.94 | 0.343 |
| 7 | 0.119 | 0.245 | 11.34 | 0.112 |
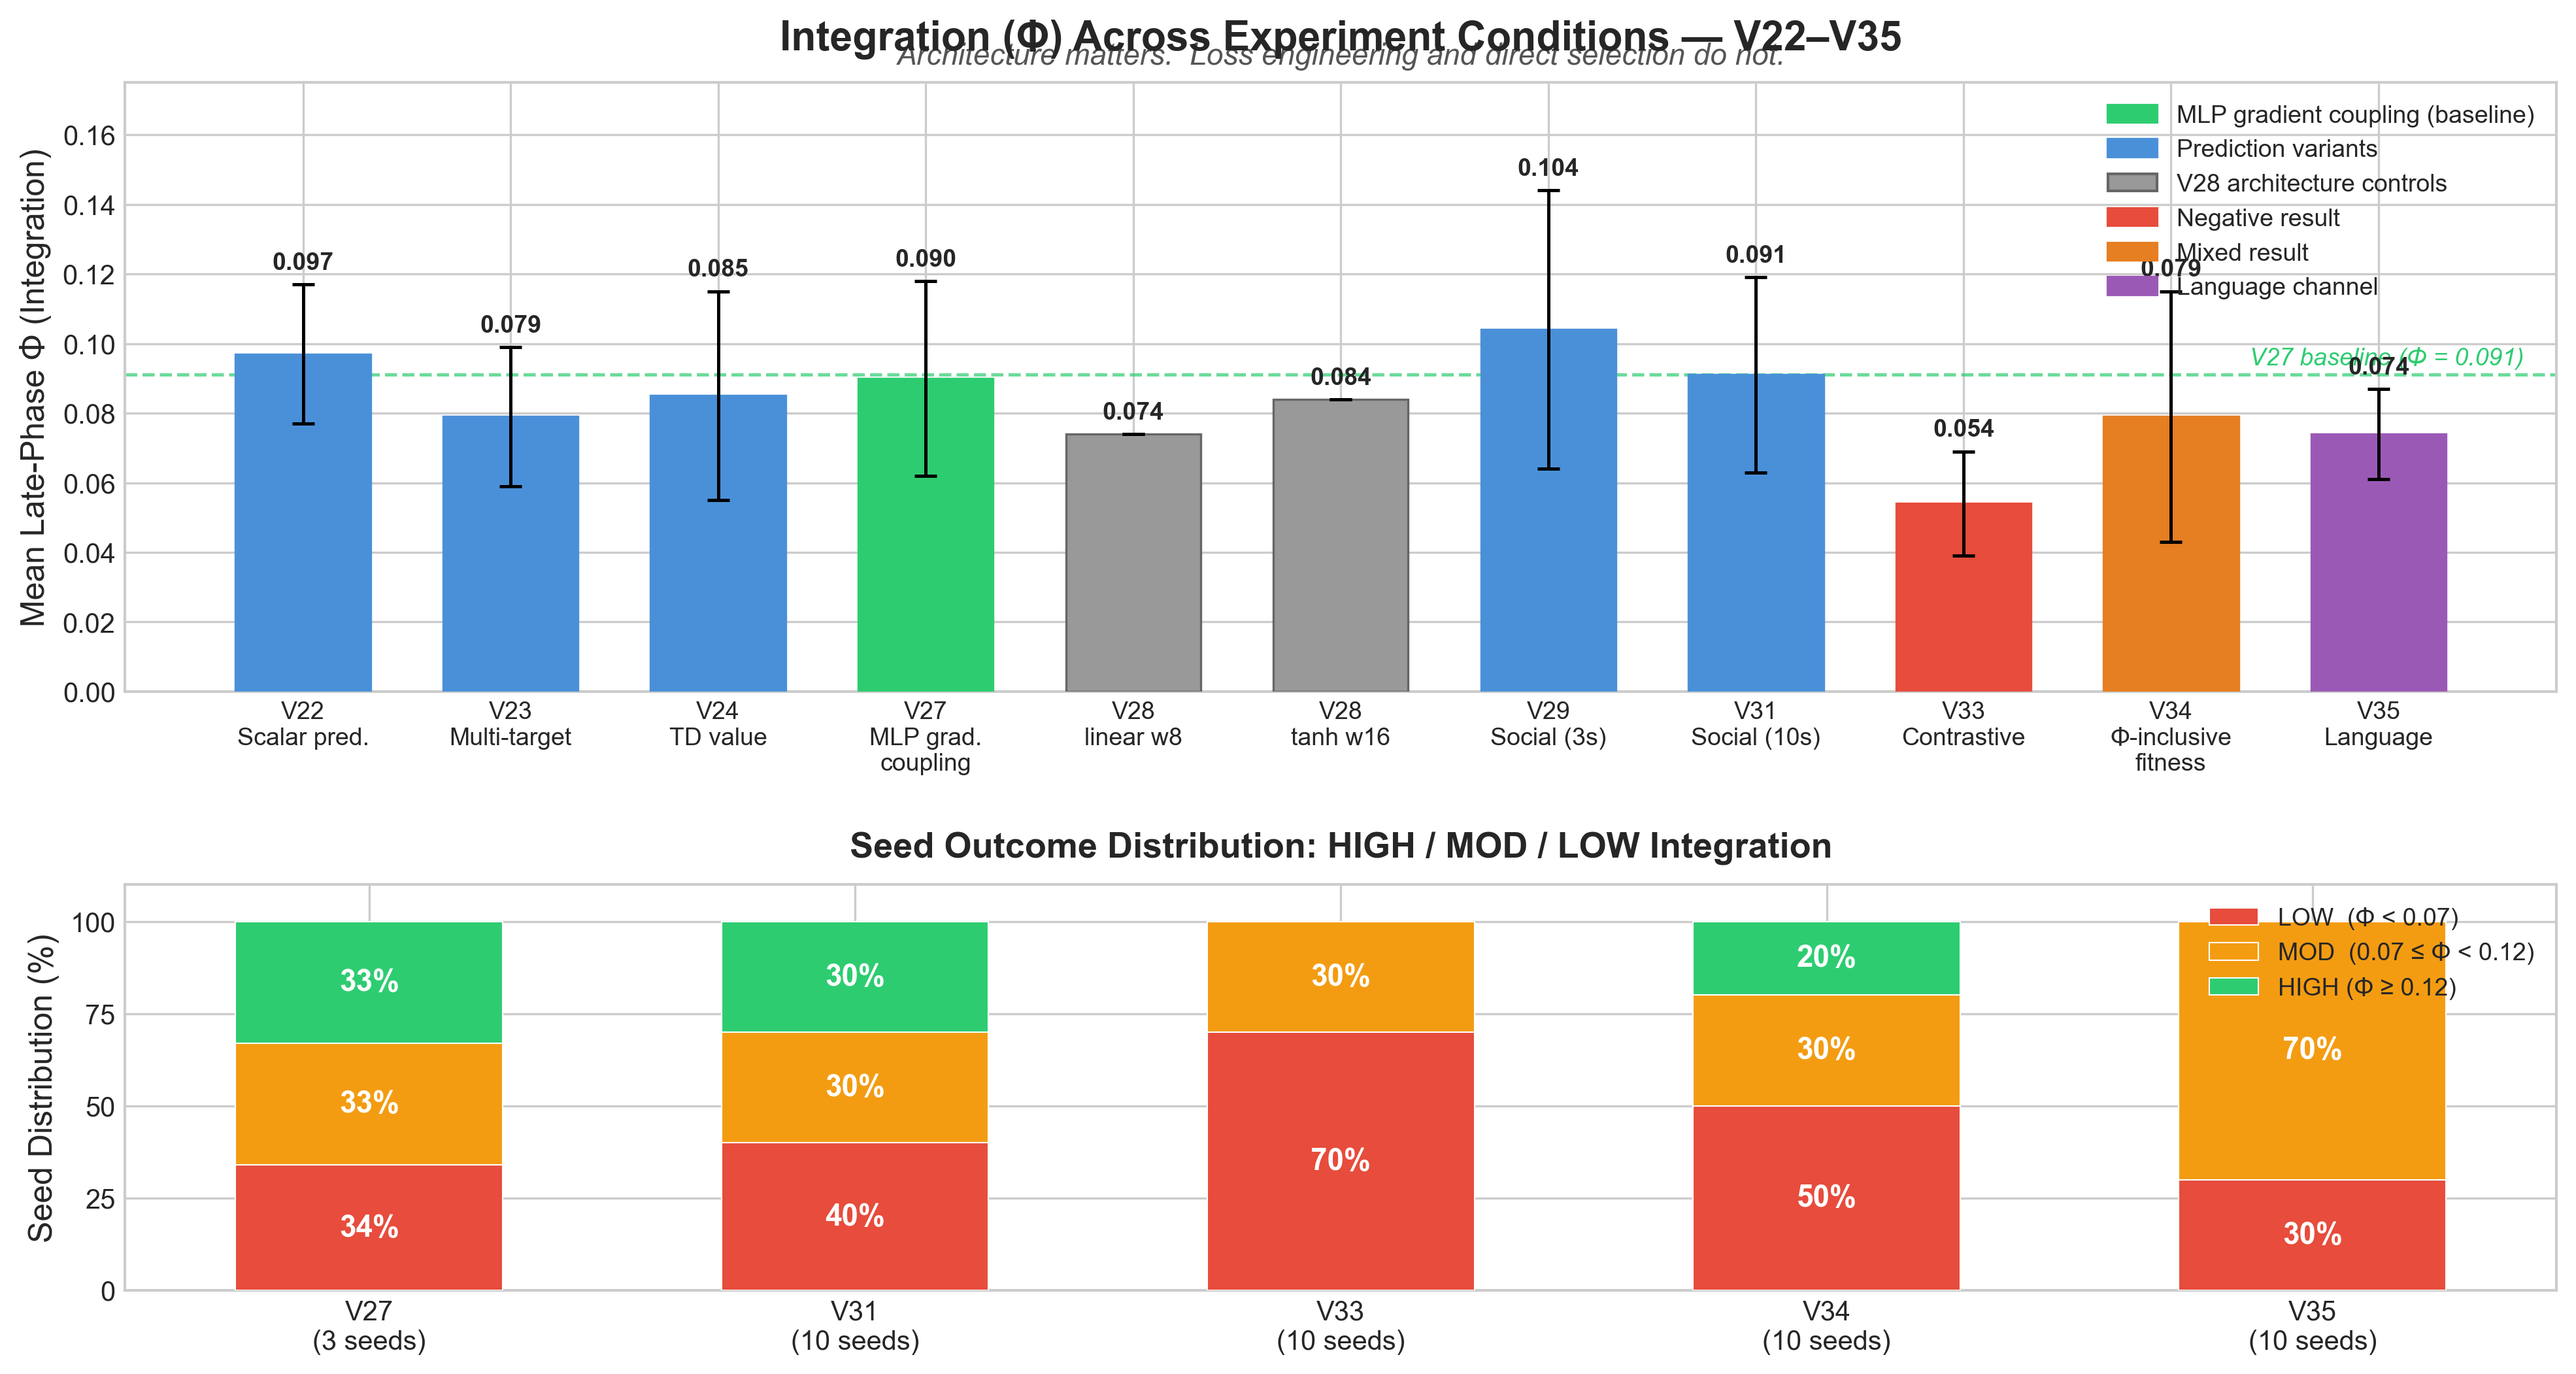
Here is what this shows, stated more carefully than I first stated it. The three-seed mean, 0.090, is below 's 0.097. The maximum in one seed, 0.245, is two and a half times anything a linear head produced, and behavioral modes appeared in hidden-state space for the first time. swept width and nonlinearity, linear at width 8 against tanh at widths 4 and 16, and found 0.074, 0.069, and 0.084: no difference among the three. So the two-layer head did not raise mean integration. It widened the tail. At fifty seeds () that tail is about a fifth of seeds above 0.10 and a maximum of 0.473. Nobody has run fifty seeds of the linear head, so whether the tail is a property of gradient coupling or of sample size is not known, and that control is the first experiment owed. What can be said: gradient coupling through composition is the only intervention that has produced high-integration seeds at all, and the prediction target makes no difference.
Study record: metadata, result path, seeds, source code, and key finding for .
Study record: metadata, result path, seeds, source code, and key finding for .
V14: The Social Target
The Snapshot Bug
The evolution loop, and the two removed environment variants built on it, reset hidden states to zero before saving snapshots, so every hidden-state analysis on those runs was on zero vectors. The "one-dimensional energy counter" finding was wrong. Corrected data give effective rank 5 to 7, energy decoding negative, and first-component variance 25 to 38 percent. Hidden states are moderately rich and do not encode energy linearly. When hidden states look degenerate, first check that you are analyzing post-cycle states and not reset buffers. This retraction is why the biographical claim below was held to a replication standard.
V15: Integration Is Biography
Fifty seeds, thirty cycles, five droughts each, 250 drought events, mean drought mortality 96.8 percent. Mean ; 22 percent high, 46 moderate, 32 low; maximum 0.473 in seed 23.
The first drought's bounce does not predict a seed's final category (, ). The mean bounce across all five droughts does (, ). The slope of the trajectory separates the categories, every high seed positive and every low seed negative, though a slope fit to its own outcome is weak evidence on its own. Robustness, surviving droughts well, is orthogonal to integration (), and effective rank does not differ across categories.
This had a null to beat. A fifth of seeds ending high, with the category set by trajectory, is also what a noisy quantity with sensitive dependence on path would look like. So the whole fifty-seed protocol was re-run from scratch on different hardware, an NVIDIA GB10 under a different JAX, with a pure-numpy re-implementation of the measure (). Per-seed late reproduced at across the fifty seeds, matched per-cycle trajectories agreed to about , the category distribution reproduced, and every alive-bearing snapshot carried real signal, so the zeroed-buffer artifact is absent from this path. A noisy quantity with no stable latent cause would not reproduce per seed across independent runs. This one does, and it is predictable from features computed before the outcome, mean bounce and not first bounce. That is the one result in this program I would defend without qualification.
Study record: metadata, result path, seeds, source code, and key finding for .
V16–V19
predicted the difference between the actual and an alternative action's outcome, hoping to force counterfactual representation, and destabilized learning: mean 0.054, no high seeds, all three pre-registered predictions falsified. put directly in the fitness function and did not change the high fraction, with two of ten seeds Goodharting. Integration cannot be selected for directly. gave agents eight discrete symbols under partial observability and cooperative pressure; every seed used every symbol at 83 percent of maximum entropy, with resource mutual information of 0.001 to 0.005, and no integration lift, against symbol-use correlation 0.07. That is symbol use, cheap and universal under these conditions, and whether it refers to anything is not shown. is per-timestep trajectory data for one focal agent in the seed-23 lineage, the source for the visualizations, not an experiment.
Study record: metadata, result path, seeds, source code, and key finding for .